Monday, November 27, 2017

Apache SOLR introduction & installation

In this post, we are going to discuss about Apache Solr and how to install them step by step.

Why Solr?


Lucene:

  • Search storage engine
  • Solr uses concepts derived from Lucene
  • Lucene is widely used in many projects among one of them is solr
  • Used to index & search with high performance.
  • Solr uses lucene as its backend
Solr:
  • Search server
  • Document oriented
  • Stores data & indexing
  • Searches including full-text search, stemming,hit-highlighting, faceted-search etc that cannot done by native databases
  • Vertically and horizontally scalable
  • Replication for high availability
  • Sharding for distributed search
  • Performs in memory,grouping,counting,similar products in single shot
  • Exposed over HTTP,REST like api.
  • The DataImportHandler provides a configuration driven way to import data from relational databases or XML files, into Solr in both “full import” and “incremental delta import” mode.

INVERTED INDEX:

  • Searches document by unique word
  • Similar to the index back of back

D1- I like Apache services.
D2- They include all kind of database & services support.
D3- I would recommend their services to my clients too.

Working:
  • Define a schema. 
  • Deploy Solr.
  • Feed Solr documents for which your users will search.
  • Expose search functionality in your application.
Solr schema:
  • No schema
  • Has index that contain docs
  • Fields are used to index,search & store

Define a schema
The schema tells Solr about the contents of documents it will be indexing. In the online store example, the schema would define fields for the product name, description, price, manufacturer, and so on. 

Defining fields:

Indexing:
Indexing is a technique of adding Document’s content to Solr Index so that we can search them easily. Apache Solr uses Apache Lucene Inverted Index technique to Index it’s documents. That’s why Solr provides very fast searching feature.

Field analyzers: (Analyzer=tokenizer+filters)

Used both during ingestion, when a document is indexed, and at query time.Analyzers may be a single class or series of tokenizer and filter classes.


Alternative words-finish,complete
misspelled-google,gogle

Tokenizers:
Break field data into lexical units, or tokens.
Pre- Stripping html tags
Post-Stemming(replace) tables as collection
         Stop word filter (the,is,and)

Filters:(used for indexing)
  • Examine a stream of tokens and keep them, transform or discard them, or create new ones. 
  • Tokenizers and filters may be combined to form pipelines, or chains, where the output of one is input to the next. 
  • Such a sequence of tokenizers and filters is called an analyzer and the resulting output of an analyzer is used to match query results or build indices.
eg)ram,RAM,Ram


Deploying Solr

Pre requisites:

yum update
yum install java-1.8.0-openjdk.x86_64
java -version

Installation:

tar zxvf solr-6.6.1.tgz
cp /opt/solr-6.6.1/bin/install_solr_service.sh .
rm -rf solr-6.6.1
./install_solr_service.sh solr-6.6.1.tgz
ps -ef | grep solr


Feed Solr documents for which your users will search Creating a project(core): A Core is an Index of texts and fields available in all documents. One Solr Instance can contain one or more Solr Cores. /opt/solr-6.6.1/bin/solr create -c jerwin Create new document : We can create a new document to the core with 3 fields and value using the below command on the terminal using curl: curl http://localhost:8983/solr/jerwin/update -d ' [ {"id" : "db1", "company_name" : "Mafiree", "location" : "Nagercoil" } ]'


View:

The inserted data can be viewed with the id specified.
curl http://localhost:8983/solr/jerwin/get?id=db1


Output can be viewed in the browser:


Hope this gives you simple introduction about SOLR,let me know if you have any concerns via comments.

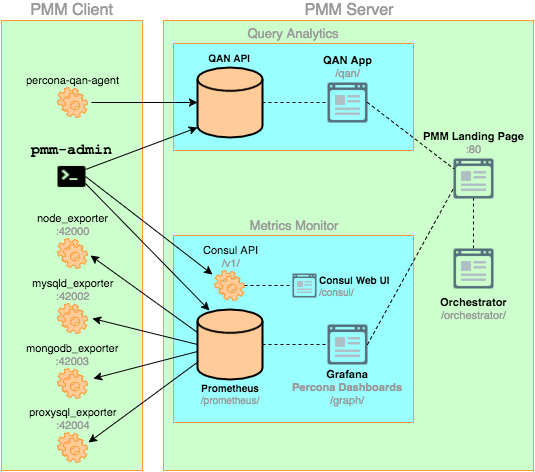

Explaining PMM server by Percona


Percona Monitoring and Management 
PMM Client
It is installed on every database host that you want to monitor. It collects server metrics, general system metrics, and query analytics data for a complete performance overview. Collected data is sent to the PMM Server.

PMM Server
It is the central part of PMM that aggregates collected data and presents it in the form of tables, dashboards, and graphs in a web interface.


PMM Client
PMM Client packages consist of the following:
pmm-admin is a command-line tool for managing PMM Client, for example, adding and removing database instances that you want to monitor.
percona-qan-agent is a service that manages the Query Analytics (QAN) agent as it collects query performance data. It also connects with QAN API in PMM Server and sends over collected data.
node_exporter is a Prometheus exporter that collects general system metrics
mysqld_exporter is a Prometheus exporter that collects MySQL server metrics.
mongodb_exporter is a Prometheus exporter that collects MongoDB server metrics.
proxysql_exporter is a Prometheus exporter that collects ProxySQL performance metrics.

PMM Server
PMM Server consists of the following tools:
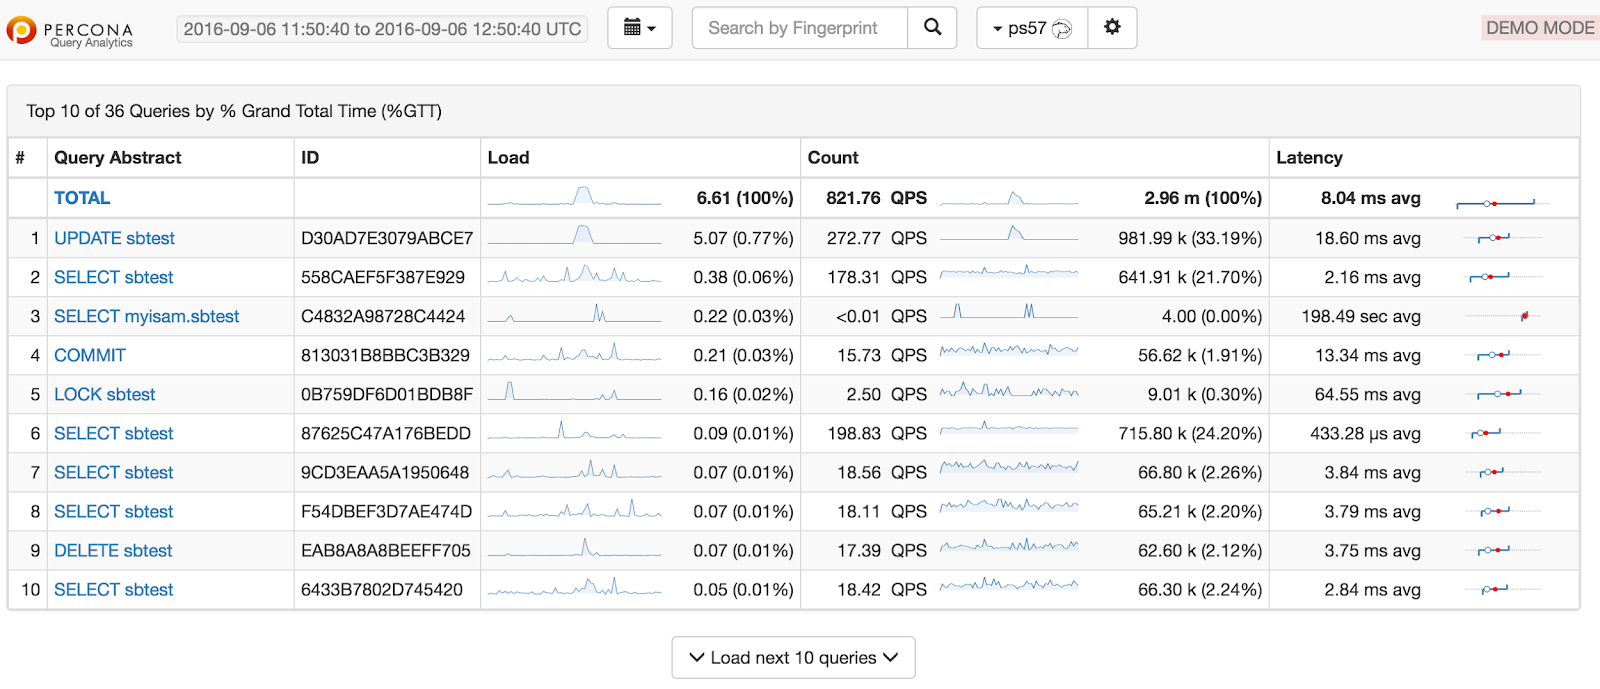
Query Analytics (QAN) enables you to analyze MySQL query performance over periods of time. In addition to the client-side QAN agent, it includes the following:
QAN API is the backend for storing and accessing query data collected by percona-qan-agent running on a PMM Client.
QAN Web App is a web application for visualizing collected Query Analytics data.
Metrics Monitor (MM) provides a historical view of metrics that are critical to a MySQL or MongoDB server instance.


The summary table contains top 10 queries ranked by %GTT (percent of grand total time)
Query details-mysql
Performance schema-mysql
Prometheus is a third-party time-series database that connects to exporters running on a PMM Client and aggregates collected metrics.
Consul provides an API that a PMM Client can use to remotely list, add, and remove hosts for Prometheus. It also stores monitoring metadata.
Grafana is a third-party dashboard and graph builder for visualizing data aggregated by Prometheus.
Percona Dashboards is a set of dashboards for Grafana developed by Percona.
Orchestrator is a MySQL replication topology(NODE) management and visualization tool.
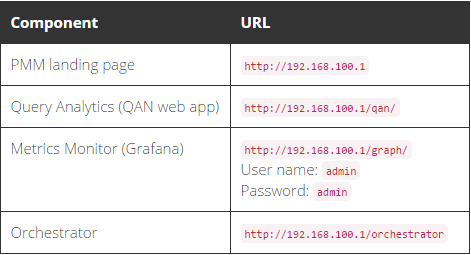
All tools can be accessed from the PMM Server web interface (landing page).Special users must be created for topology generation.
PMM server running methods:
Run PMM Server using Docker
Run PMM Server as a virtual appliance(VM ware,VirtualBox)
Run PMM Server using Amazon Machine Image (AMI)

Docker
Docker is a tool designed to make it easier to create, deploy, and run applications by using containers.
It extracts all the needed packages from https://github.com/docker.

Running PMM Server Using Docker
Step 1. Create a PMM Data Container
docker create \
  -v /opt/prometheus/data \
  -v /opt/consul-data \
  -v /var/lib/mysql \
  -v /var/lib/grafana \
  --name pmm-data \
  percona/pmm-server:1.1.5 /bin/true
docker create-instructs the Docker daemon to create a container from an image.
v- initialize data volumes for the container.
name-assigns a custom name for the container
percona/pmm-server:1.1.5 is the name and version tag of the image to derive the container from.
Step 2. Create and Run the PMM Server Container
docker run -d \
  -p 80:80 \
  --volumes-from pmm-data \
  --name pmm-server \
  --restart always \
  percona/pmm-server:1.1.5
run-instructs the docker daemon to run a container from an image.
d-starts the container in detached mode(bg)
p-port
volumes from-mounts volumes from the pmm-data container
restart-defines the container’s restart policy

Verifying PMM Server
Checkout access the PMM web interface using the IP address of the host where the container is running.

Connecting PMM Client to PMM Server
To connect the client to PMM Server, specify the IP address using the pmm-admin config --server command
$ sudo pmm-admin config --server 192.168.100.1
OK, PMM server is alive.

PMM Server      | 192.168.100.1
Client Name     | ubuntu-amd64
Client Address  | 192.168.200.1

Starting Data Collection
After you connect the client to PMM Server, enable data collection from the database instance by adding a monitoring service.
To enable general system metrics, MySQL metrics, and query analytics, run:
sudo pmm-admin add mysql
To enable general system metrics and MongoDB metrics, run:
sudo pmm-admin add mongodb
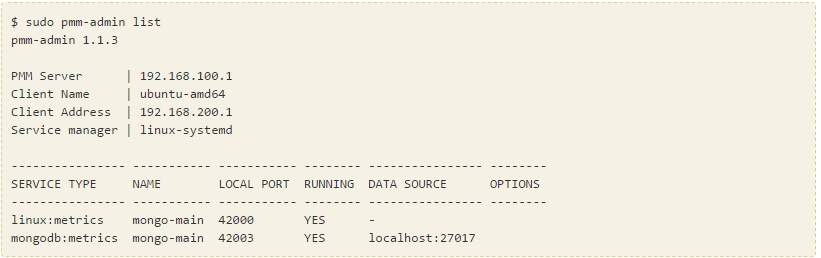
To see what is being monitored, run:
$ sudo pmm-admin list

Upgrading PMM Server
Stop the server
$ docker stop pmm-server
Remove the old server
$ docker rm pmm-server
Run the new one
$ docker run -d \
  -p 80:80 \
  --volumes-from pmm-data \
  --name pmm-server \
  --restart always \
  percona/pmm-server:1.1.5

Upgrading PMM Client
For Debian or Ubuntu:
$ sudo apt-get update && sudo apt-get install pmm-client
For RedHat or CentOS:
$ yum update pmm-client
Removing PMM Server
Stop and remove the pmm-server container:
$ docker stop pmm-server && docker rm pmm-server
If you also want to discard all collected data, remove the pmm-data container:
$ docker rm pmm-data
Removing PMM Client
If you installed using RPM packages:
$ rpm -e pmm-client
If you installed using YUM:
$ yum remove pmm-client
If you installed using DEB packages:
$ dpkg -r pmm-client
If you installed using APT:
$ apt-get remove pmm-client

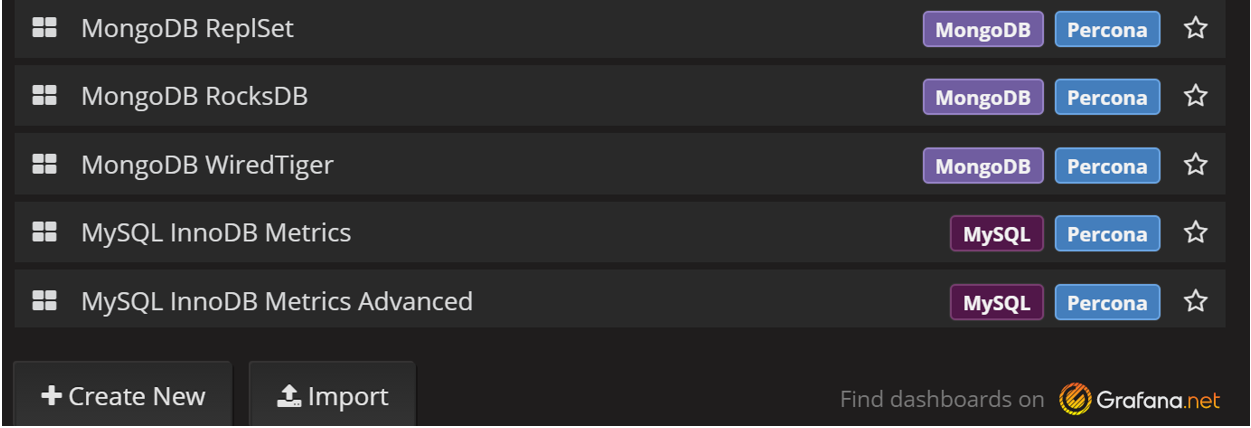
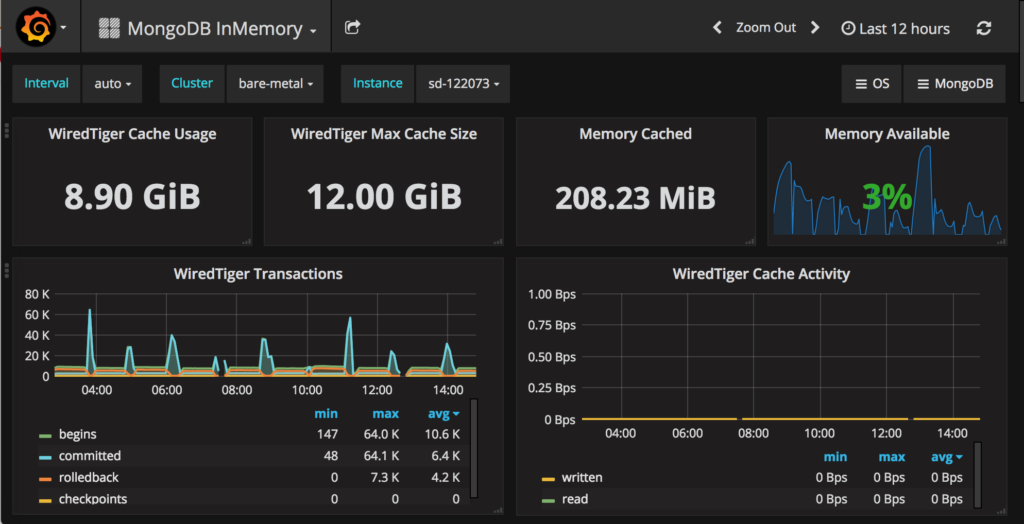
Dashboards:


Wednesday, July 08, 2015

To View current running operations in MongoDB

Every database includes multiple currentoperations running in the server. In this blog, we shall discuss the process list in MongoDB.

                    MongoDB is used to display all the documents that contains information on in-progress operations for the database instance which can be done using db.currentop() operation.If you pass a query document to db.currentOp(), the output returns information only for the current operations that match the query.In this post we are going to see the various output that are return by db.currentop().

To view the current active queries in the database:
db.currentOp(
      {
        "active" : true
    }
    )


To view the queries that are running more than ‘x’ seconds in the database:
db.currentOp(
      {
        "active" : true,
        "secs_running" : { "$gt" : 10}
      }
    )

To view the queries that are waiting for a lock and not a read:
db.currentOp().inprog.forEach(
      function(d){
        if(d.waitingForLock && d.lockType != "read")
          printjson(d)
        })


To view all active read queries:
db.currentOp().inprog.forEach(
      function(d){
        if(d.active && d.lockType == "read")
          printjson(d)
        })


To view all active write queries:
db.currentOp().inprog.forEach(
      function(d){
        if(d.waitingForLock && d.lockType != "write")
           printjson(d)
        })


Kill the queries:
                              Incase if some of the queries that are running for more seconds and are degrading the database performance you can kill the using killOp() operation.The necessary parameter to kill is the opid(operation id) that will be returned by the currentOp().To kill a query with the opid 3258220 issue the below command.
db.killOp(3258220)

              So once done the query that has been mentioned will be killed which you can check again using the db.currentOp().


User creation in MongoDB

                   Security is a foremost criteria in the databases. Proper authentication in the databases must be enabled to ensure high security.Users in the database paves a way for the better authentication in databases.In this post we are going to see how to create the users once you are done with the MongoDb installation.Its necesary to create the required range of the users.Each users have their own roles that they can perform.The following are the some users that are very much necessary in the mongodb databases .

Administrator user:
                     This user can grant themselves privileges in excess of their current privileges and even can grant themselves all privileges, even though the role does not explicitly authorize privileges beyond user administration.It is also a typical superuser in the database.
use admin

db.createUser(
 {
   user: "UserAdmin",
   pwd: "password",
   roles: [ { role: "userAdminAnyDatabase", db: "admin" } ]
 }
)
Root user:
                          It provides access to the operations and all the resources of the readWriteAnyDatabase, dbAdminAnyDatabase, userAdminAnyDatabase and clusterAdmin roles combined also this user does not include any access to collections that begin with the system. prefix.
use admin

db.createUser(
{
user: "root",
pwd: "password",
roles: [ "root" ]
}
)
Read/Write user:
This user provides the read and write permissions for a particular database that is specified.
use admin
db.createUser(
  {
    user: "rw_user",
    pwd: "password",
    roles:
      [
        { role: "readWrite",db:"test_db"}
      ]
  }
)
Read user:
This user provides only the read permissions for a particular database that is specified.
use admin

db.createUser(
  {
    user: "read_user",
    pwd: "password",
    roles:
      [
        { role: "read",db:"test_db"}
      ]
  }
)
Write user:
This user provides only the write permissions for a particular database that is specified.
use admin

db.createUser(
  {
    user: "write_user",
    pwd: "password",
    roles:
      [
        { role: "write",db:"test_db"}
      ]
  }
)

Backup User:
This user is used to perform only the backup operations in the database.So in case you have single instance its enough to have the following role:
use admin

db.createUser(
  {
    user: "backup",
    pwd: "password",
    roles:
      [
        { role: "dbAdmin",db:"admin"}
      ]
  }
)

Incase you maintain any shard or replica you can have the below role:

use admin

db.createUser(
  {
    user: "backup",
    pwd: "password",
    roles:
      [
        { role: "clusterdbAdmin",db:"admin"}
      ]
  }
)

Check user privileges:
Its very much necessary to see what are all the privileges that are given to a particular user,to find them use the below query:

db.runCommand(
              {
                usersInfo:  { user: "root", db: "admin" },
                showPrivileges: true
              }
)

                    You can also create your own users similarly mentioned above if you have more ideas about the roles needed.To know more about the mongodb roles check this link.