
Percona Monitoring and Management
PMM Client
It is installed on every database host that you want to monitor. It collects server metrics, general system metrics, and query analytics data for a complete performance overview. Collected data is sent to the PMM Server.
PMM Server
It is the central part of PMM that aggregates collected data and presents it in the form of tables, dashboards, and graphs in a web interface.
PMM Client
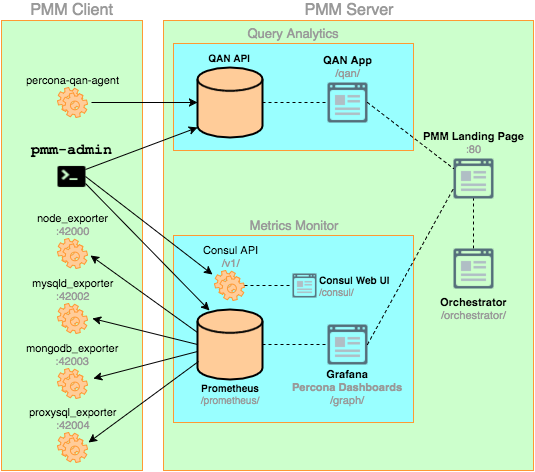
PMM Client packages consist of the following:
pmm-admin is a command-line tool for managing PMM Client, for example, adding and removing database instances that you want to monitor.
percona-qan-agent is a service that manages the Query Analytics (QAN) agent as it collects query performance data. It also connects with QAN API in PMM Server and sends over collected data.
node_exporter is a Prometheus exporter that collects general system metrics
mysqld_exporter is a Prometheus exporter that collects MySQL server metrics.
mongodb_exporter is a Prometheus exporter that collects MongoDB server metrics.
proxysql_exporter is a Prometheus exporter that collects ProxySQL performance metrics.
PMM Server
PMM Server consists of the following tools:
Query Analytics (QAN) enables you to analyze MySQL query performance over periods of time. In addition to the client-side QAN agent, it includes the following:
QAN API is the backend for storing and accessing query data collected by percona-qan-agent running on a PMM Client.
QAN Web App is a web application for visualizing collected Query Analytics data.
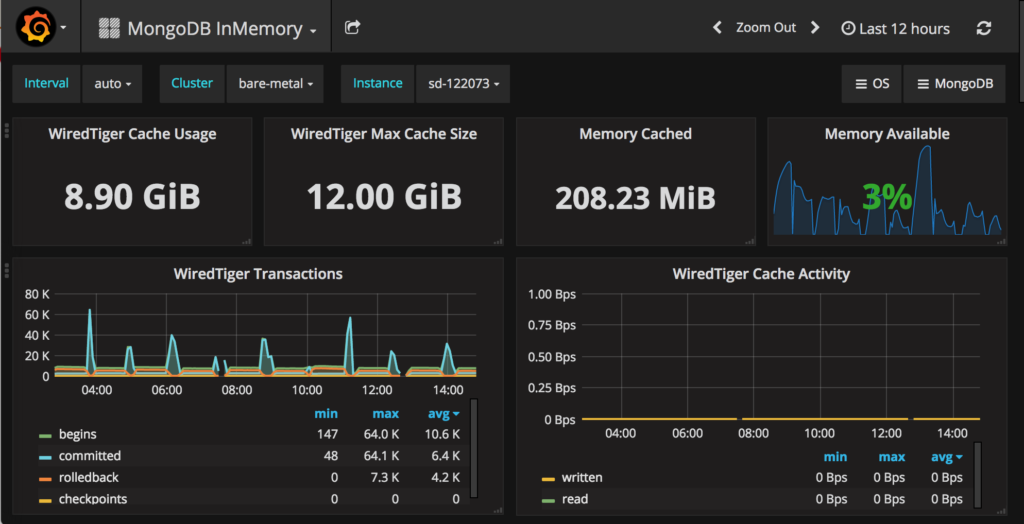
Metrics Monitor (MM) provides a historical view of metrics that are critical to a MySQL or MongoDB server instance.
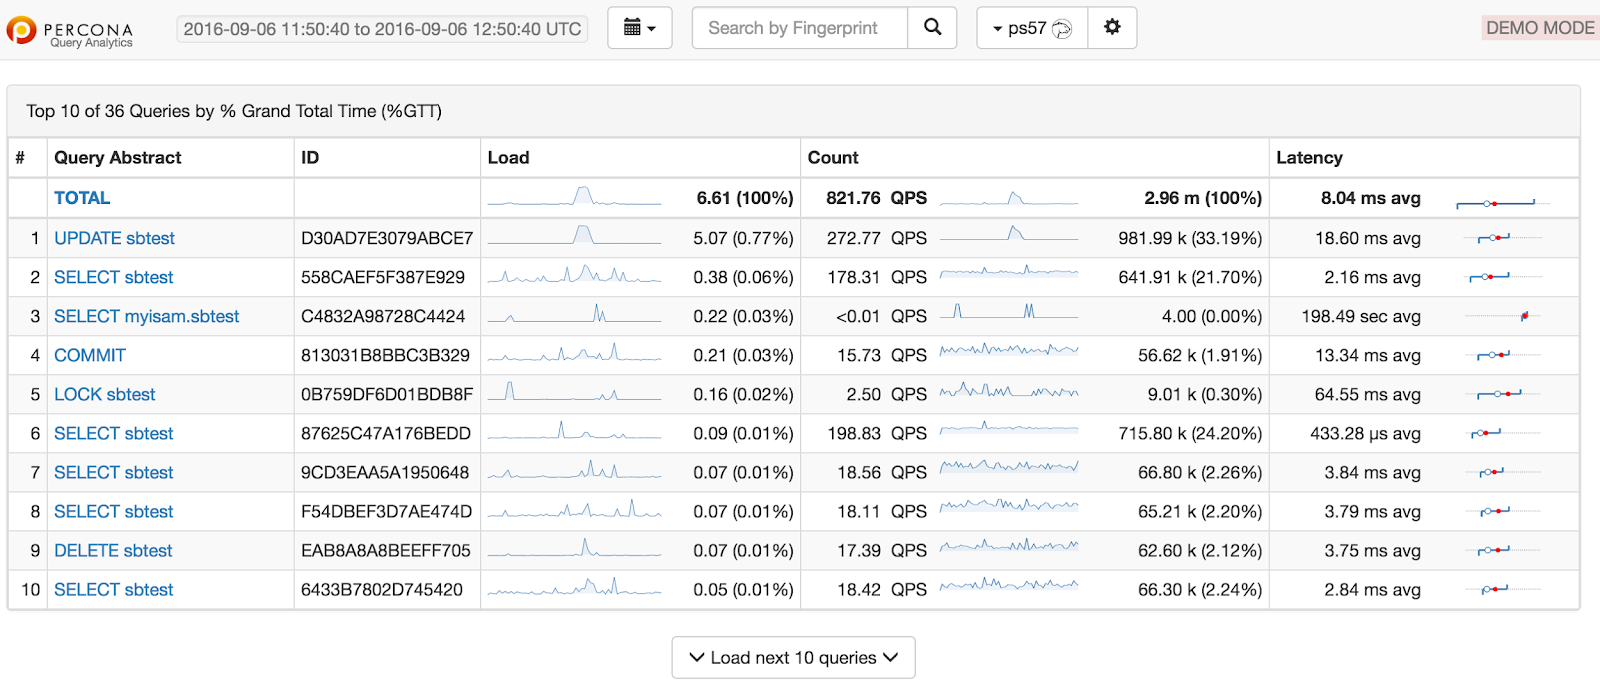
The summary table contains top 10 queries ranked by %GTT (percent of grand total time)
Query details-mysql
Performance schema-mysql
Prometheus is a third-party time-series database that connects to exporters running on a PMM Client and aggregates collected metrics.
Consul provides an API that a PMM Client can use to remotely list, add, and remove hosts for Prometheus. It also stores monitoring metadata.
Grafana is a third-party dashboard and graph builder for visualizing data aggregated by Prometheus.
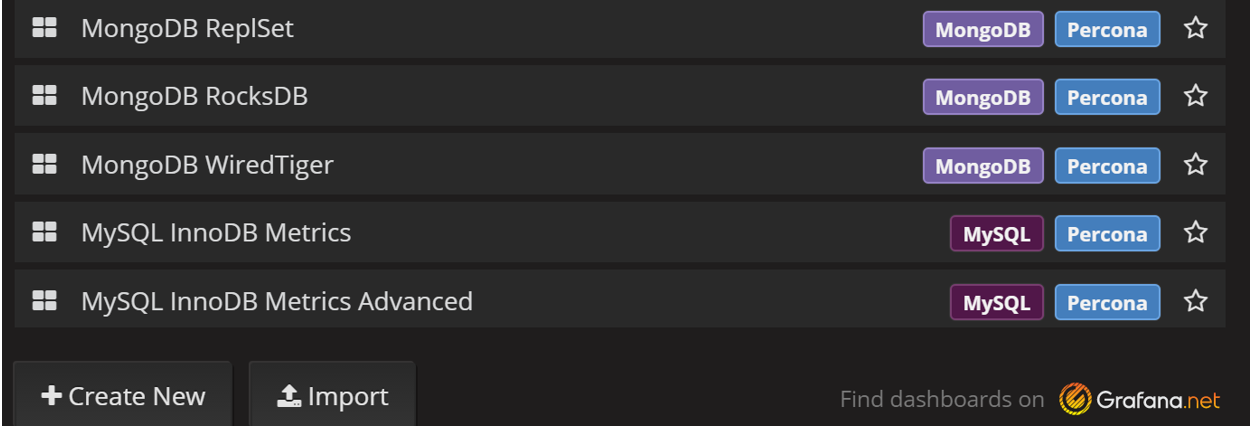
Percona Dashboards is a set of dashboards for Grafana developed by Percona.
Orchestrator is a MySQL replication topology(NODE) management and visualization tool.
All tools can be accessed from the PMM Server web interface (landing page).Special users must be created for topology generation.
PMM server running methods:
Run PMM Server using Docker
Run PMM Server as a virtual appliance(VM ware,VirtualBox)
Run PMM Server using Amazon Machine Image (AMI)
Docker
Docker is a tool designed to make it easier to create, deploy, and run applications by using containers.
It extracts all the needed packages from https://github.com/docker.
Running PMM Server Using Docker
Step 1. Create a PMM Data Container
docker create \
-v /opt/prometheus/data \ -v /opt/consul-data \ -v /var/lib/mysql \ -v /var/lib/grafana \ --name pmm-data \ percona/pmm-server:1.1.5 /bin/true |
docker create-instructs the Docker daemon to create a container from an image.
v- initialize data volumes for the container.
name-assigns a custom name for the container
percona/pmm-server:1.1.5 is the name and version tag of the image to derive the container from.
Step 2. Create and Run the PMM Server Container
docker run -d \
-p 80:80 \ --volumes-from pmm-data \ --name pmm-server \ --restart always \ percona/pmm-server:1.1.5 |
run-instructs the docker daemon to run a container from an image.
d-starts the container in detached mode(bg)
p-port
volumes from-mounts volumes from the pmm-data container
restart-defines the container’s restart policy
Verifying PMM Server
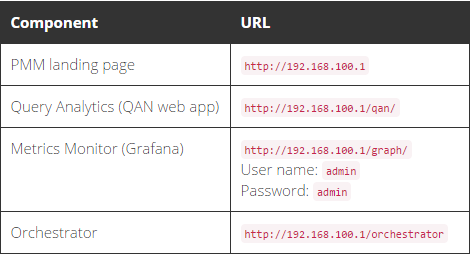
Checkout access the PMM web interface using the IP address of the host where the container is running.
Connecting PMM Client to PMM Server
To connect the client to PMM Server, specify the IP address using the pmm-admin config --server command
$ sudo pmm-admin config --server 192.168.100.1
OK, PMM server is alive. PMM Server | 192.168.100.1 Client Name | ubuntu-amd64 |
Client Address | 192.168.200.1
Starting Data Collection
After you connect the client to PMM Server, enable data collection from the database instance by adding a monitoring service.
To enable general system metrics, MySQL metrics, and query analytics, run:
sudo pmm-admin add mysql
To enable general system metrics and MongoDB metrics, run:
sudo pmm-admin add mongodb
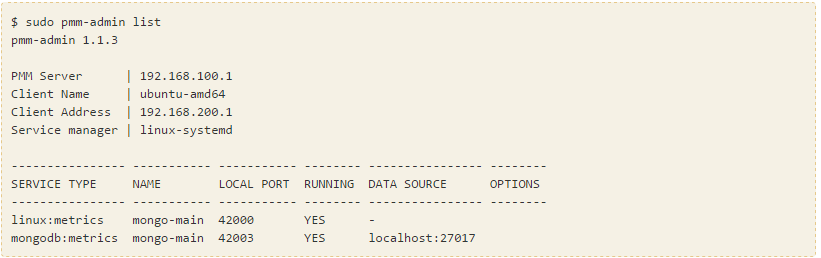
To see what is being monitored, run:
$ sudo pmm-admin list
Upgrading PMM Server
Stop the server
$ docker stop pmm-server
Remove the old server
$ docker rm pmm-server
Run the new one
$ docker run -d \
-p 80:80 \ --volumes-from pmm-data \ --name pmm-server \ --restart always \ percona/pmm-server:1.1.5 |
Upgrading PMM Client
For Debian or Ubuntu:
$ sudo apt-get update && sudo apt-get install pmm-client
For RedHat or CentOS:
$ yum update pmm-client
Removing PMM Server
Stop and remove the pmm-server container:
$ docker stop pmm-server && docker rm pmm-server
If you also want to discard all collected data, remove the pmm-data container:
$ docker rm pmm-data
Removing PMM Client
If you installed using RPM packages:
$ rpm -e pmm-client
If you installed using YUM:
$ yum remove pmm-client
If you installed using DEB packages:
$ dpkg -r pmm-client
If you installed using APT:
$ apt-get remove pmm-client
Dashboards:


0 comments:
Post a Comment