Monday, November 26, 2018

Cassandra Data Distribution using Partitioners


Before wading through the partitioners lets have a look how generally data is being distributed in a Cassandra
cluster. It includes a ring like a topology between the nodes. Here the data are being broken into tokens and are circulated
among the nodes through the Cassandra ring. Data is distributed across the cluster by the value of the token by using the
hash technique. Based on the value of the tokens the data will be evenly distributed among the cluster. The main advantage
of this method is the data retrieval process can be quick based on the token range. Now we can have can see what does a
partitioner role in a cluster in detail.

Partitioners
Partitioners allow how row keys should be sorted and how data will be distributed across your nodes in the cluster. The
read/write request to the cluster are evenly distributed when each part of the hash range receives the same number of
tokens on average. Based on the difference in the hash methods partitioners are classified into three types as below:

  • Murmur3Partitioner
  • RandomPartitioner
  • Byte Ordered Partitioner

Murmur3 Partitioner
This is the default partitioning strategy for Cassandra. It provides fast hashing and good performance. It
uses MurmurHash hash values to distribute the data across the clusters.

Random Partitioner
It involves MD5 hash applied to place the keys on the node ring. An MD5 hash provides a natural way of
load balancing keys to nodes. Each data item is mapped to a token by calculating the MD5 hash of its key
The disadvantage of this method is that it causes inefficient range queries when keys specified in the range
might be in another ring.

Byte Ordered Partitioner
This method involves the distribution of the data lexically by key bytes in an ordered manner. It treats
the data as raw bytes, instead of converting them to strings. This is most likely to use when you want a
partitioner that doesn't want to validate the keys as being strings.

How to change a Partitioner?
So based on the need for the application you can choose any one of the above partitioners. In order
to apply it make the below change in the cassandra.yaml file. This file will be generally located in conf
directory.

So this is all about how a data is distributed among the Cassandra cluster and how partitioner helps more
for the sorting of data & retrieving them. Got any queries about partitioners to comment on them.

Thursday, November 01, 2018

MongoDB Storage Engines

The storage engine is a vital component for managing and storing data in the memory as well as disk. MongoDB supports multiple storage engines with unique features for better performance. In this blog, we are going to discuss the various storage engines and their features.
Types of Storage Engine:

Our production workload will be different for each application, some will be writing intensive, some will be read and some required encryption etc. MongoDB provides flexibility to handle such workloads by providing multiple storage engines. Mentioned the storage engines below.
  • Wired Tiger
  • MMAPv1
  • Encrypted
  • In-memory
Let's see the key features of each storage engines.
Wired Tiger:
  • Wired Tiger (WT) is the default storage engine from mongo 3.0
  • WT storage engine uses document-level concurrency control for write operations so multiple clients can modify different documents of a collection at the same time.
  • It uses only intent locks at the global, database and collection levels when the storage engine detects conflicts between two operations, one will incur a write conflict causing MongoDB to transparently retry that operation
  • MongoDB utilizes both the WiredTiger internal cache and the filesystem cache. By default the wired tiger cache will use 50% of RAM minus 1 GB or 256 MB.
  • Efficient use of CPU cores and RAM
  • Allows for more tuning of storage engine than MMAP
  • 7 to 10X better write performance
  • 80% less storage with compression
  • Compression minimizes storage use at the expense of additional CPU.
  • Collection level data in the WiredTiger internal cache is uncompressed and uses a different representation from the on-disk format.
MMAP:
  • The MMAP Storage engine uses memory mapped files to store its data
  • A segment of virtual memory which has been assigned a direct byte-for-byte correlation with some portion of a file
  • It is a traditional storage engine that allow great deal of performance for heavy read applications
  • Data and indexes are mapped into virtual space
  • Data access is placed into RAM
  • When the OS runs out of RAM and an application requests for memory,then it will swap out memory to disk to make space for the newly requested data
  • The operating system’s virtual memory subsystem manages MongoDB’s memory
  • Deployments with enough memory to fit the application’s working data set in RAM will achieve the best performance.

Encrypted:
  • Available in mongodb enterprise only.
  • The default encryption mode that MongoDB Enterprise uses is the AES256-CBC
  • All data files are fully encrypted from a file system
  • Unencrypted state in memory and during transmission
  • Master keys and database keys are used for encryption
  • Data is encrypted with the database keys,master key encrypts the database keys
  • Encryption is not a part in replication keys are not replicated
  • In replication data is not natively encrypted over the wire
  • Application Level Encryption provides encryption on a per-field or per-document basis within the application layer

In-memory:
  • It is available in the enterprise editions starting from version 3.2.6.
  • Handles ultra high throughput with low latency and high availability
  • In-memory storage engine is part of general availability
  • More predictable and low latency on less in-memory infrastructure
  • Supports high level infrastructure based on zonal sharding
  • MongodB rich query capability and indexing support

Third-party pluggable storage engines:
  • MongoDB is providing support for 3rd party storage engines as “modules” that can be independently updated.
  • When building MongoDB, any storage engine modules will be automatically detected, configured and integrated in the final binaries.
  • The RocksDB storage engine is the first one to use this new module system for their MongoDB storage integration layer
  • RocksDB for MongoDB is based on the key-value store optimized for fast storage.
  • It is developed by facebook and designed to handle write-intensive workloads.

Storage Engine application API:
As mentioned, each application load will be different from other. Choosing the right storage engine will definetly boost the performance. Differentiated storage engine with respect to the workload which helps in choosing the right storage engine.
Comparison chart:
The overall feature comparison for all the storage engines are listed below:

MongoDB Free monitoring on Community version 4.0 explained

I was just playing around with MongoDB 4.0 community version & noticed a feature called free monitoring. In this article let have a detailed look of free monitoring, how to enable, check status and what are the monitoring metrics that are provided by MongoDB.

Free Monitoring:
Free monitoring is a service that is available in the MongoDB 4.0 Community versions. It provides us with some graphical/statistical data related to currently deployed instances which expire after 24 hours. So let's have a look how can we enable free monitoring & look at what is in it.

Enabling Monitoring:
This command enabled the free monitoring in the instance, one-time enabling is enough it is not necessary to enable each time to check the status. 

db.enableFreeMonitoring()
Check Monitoring status:
In order to check the current free monitoring status the above command which let us know the status. When once enabled, the monitored data is uploaded periodically to the cloud & it can be accessed via browsers through the provided URL. 
db.getFreeMonitoringStatus() 

Graph options:
Let's have a look over the various graph parameters that are included in the free monitoring.

Operation Execution:
This lists out the how many times the operations are being executed in the server. Operations include reads, writes & commands.

Disk Utilization:
Every disk has its own read & write speed. Disk utilization involves the sum of the total speed of data that is being written to and read from the disk. This graph plots out the maximum & average disk used by the drives.

Documents:
This returns the stats of the documents that are returned, inserted, updated & deleted

Memory:
MongoDB uses virtual as well as the resident memory. Resident memory is the memory that is used by RAM. In some cases, the operating system returns the imaginary address when MongoDB requests for memory address which is not real. If the journal is enabled then it returns another address for journal data, both together is the Virtual memory. Journal reference memory alone is known as the mapped memory.

Network IO:
This refers to the total network traffic that is being received and sent by MongoDB in bytes.

Opcounters:
Opcounters are nothing but the total list of the operations count that is being performed by the server. It included the operations such as insert, query, update, delete,getmore, commands.

Replicated Opcounters:
This refers the opcounters that are being replicated to the other secondaries in the replica cluster. The value of replicated opcounters will be present only if the instance is a replica set.

Query Targeting:
This chart depicts the query & objects that are scanned by the process.

Queue:
This parameter lists out the total number of reads,writes that are currently waiting under the queue or waiting for any other lock.

System CPU usage:
It explains about the complete system CPU usage with respect to the some of the specialized factors.


Consistency levels in Apache Cassandra explained

Cassandra is scalable column-oriented open source NoSQL database. It is the right choice for managing large amounts of structured, semi-structured, and unstructured data across multiple data centers when you need scalability and high availability without compromising performance. In this article, we are going to discuss how the read/write operations are maintained in a cluster and various consistency levels in Cassandra & how can they be applied to our business applications.

According to CAP theorem, it is impossible for a distributed system to simultaneously provide all three guarantees:
  • Consistency -Every node contains same data at the same time
  • Availability- At least one node must be available to serve data every time
  • Partition tolerance -Failure of the system is very rare
"Cassandra is typically classified as an AP system, meaning that availability and partition tolerance are generally considered to be more important than consistency in Cassandra. But Cassandra can be tuned with replication factor and consistency level to also meet C.So Cassandra is eventually consistent."

Replication factor:

Before deep diving into the consistency levels its necessary to understand the term replication factor. It describes how many copies of your data exist. Based on the RF & the consistency levels it is easy to design a very good stable architecture in Cassandra.
The below terms explains how the write/read transactions serve its purpose:
Commit log − The commit log is a crash-recovery mechanism in Cassandra. Every write operation is written to the commit log.
Mem-table − A mem-table is a memory-resident data structure. After commit log, the data will be written to the mem-table. Sometimes, for a single-column family, there will be multiple mem-tables.
SSTable − It is a disk file to which the data is flushed from the mem-table when its contents reach a threshold value

Write path in Cassandra:


When a write is initiated its first captured by the commit logs. Later the data will be captured and stored in the mem-table. Whenever the mem-table is full, data will be written into the SStable data file. All writes are automatically partitioned and replicated throughout the cluster. Cassandra periodically consolidates the SSTables, discarding unnecessary data.

Read path in Cassandra:

For any read operations first, the values are fetched from the mem table and then Cassandra checks the bloom filter(cache) to find the appropriate SSTable that holds the required data.

Consistency Levels :

Consistency levels are used to manage the data consistency versus data availability. Below are the various levels of consistency that can be set to achieve the data consistency in the DB:
ALL- Writes/Reads must be written to the commit log and memtable on all in the cluster.
EACH_QUORUM- Writes/Reads must be written to the commit log and memtable on each quorum of nodes. Quorum is 51% of the nodes in a cluster.
QUORUM- Writes/Reads must be written to the commit log and memtable on a quorum of nodes across all data centers.
LOCAL_QUORUM- Writes/Reads must be written to the commit log and memtable on a quorum of nodes in the same datacenter as the coordinator.
ONE- Writes must/Reads be written to the commit log and memtable of at least one node.
TWO- Writes/Reads must be written to the commit log and memtable of at least two nodes.
THREE- Writes/Reads must be written to the commit log and memtable of at least three nodes.
LOCAL_ONE- Writes/Reads must be sent to and successfully acknowledged by, at least one node in the local datacenter.
ANY- Writes/Reads must be written to at least one node.

How to calculate the DB impact based on these parameters?

Its very easy to calculate the DB impacts for any given RF & read, write Consistency levels. For example, say let us set up a 5 node cluster with 3 RF, Read & Write Consistency level as quorum then the impact would be as below:
1.     Your reads are consistent
2.     You can survive the loss of 1 node without impacting the application.
3.     You can survive the loss of 1 node without data loss.
4.     You are really reading from 2 nodes every time.
5.     You are really writing to 2 nodes every time.
6.     Each node holds 60% of your data.
The same cluster scenario with Read & Write Consistency level as ONE will have the below impact.
1.     Your reads are eventually consistent
2.     You can survive the loss of 2 nodes without impacting the application.
3.     You can survive the loss of no nodes without data loss.
4.     You are really reading from 1 node every time.
5.     You are really writing to 1 node every time.
6.     Each node holds 60% of your data.
Thus the Cassandra cluster architecture can be defined according to our own business need with the optimal use of the resources to yield high performance.

Credits: You can use this Cassandra Parameters for Dummies to find out the impact: https://www.ecyrd.com/cassandracalculator/

Thursday, February 15, 2018

Apache solr replication step by step


Need for Replication :
  • When there is a large search volume that cannot be handled by a single machine, so you need to distribute searches across multiple read-only copies of the index.
  • If there is a high volume of indexing which consumes machine resources and reduces search performance on the indexing machine, so you need to separate indexing and searching.
  • When we want to make a backup of the index

MASTER-SLAVE


  • Distributes complete copies of a master index to one or more slave servers. 
  • The master server continues to manage updates to the index. 
  • All querying is handled by the slaves. 
  • This enables Solr to scale to provide adequate responsiveness to queries against large search volumes.
Replication Terminology:

Index
A Lucene index is a directory of files. These files make up the searchable and returnable data of a Solr Core.

Distribution
The copying of an index from the master server to all slaves. 

Inserts and Deletes
  • As inserts and deletes occur in the index, the directory remains unchanged. Documents are always inserted into newly created files. 
  • Documents that are deleted are not removed from the files.
  • They are flagged in the file, deletable and are not removed from the files until the index is optimized.
Master and Slave
  • A Solr replication master is a single node which receives all updates initially and keeps everything organized.
  • Solr replication slave nodes receive no updates directly, instead all changes (such as inserts, updates, deletes, etc.) are made against the single master node. 
  • Changes made on the master are distributed to all the slave nodes which service all query requests from the clients.

Repeater
A node that acts as both a master and a slave.

Optimization
  • A process that compacts the index and merges segments in order to improve query performance.
  • Optimization should only be run on the master nodes. An optimized index may give query performance gains compared to an index that has become fragmented over a period of time with many updates. 
  • Distributing an optimized index requires a much longer time than the distribution of new segments to an un-optimized index

Snapshot
A directory containing hard links to the data files of an index. Snapshots are distributed from the master nodes when the slaves pull them, "smart copying" any segments the slave node does not have in snapshot directory that contains the hard links to the most recent index data files.

Configuring the Replication RequestHandler on a Master Server:
commit-Triggers replication whenever a commit is performed on the master index.
optimize-Triggers replication whenever the master index is optimized.
startup-Triggers replication whenever the master index starts up.

MASTER SLAVE CONFIGURATION

MASTER

The configuration of the master are configured in the below file.

vim /var/solr/data/fortis/conf/solrconfig.xml


vim /var/solr/data/fortis/core.properties

Make the below changes in the core.properties file 

enable.master=true
enable.slave=false


SLAVE

To create a new collection use the below command

/usr/local/solr-6.6.2/bin/solr create -c prod

The configuration of the master are configured in the below file.

vim /var/solr/data/fortis/conf/solrconfig.xml


Make the below changes in the core.properties file 

vim /var/solr/data/fortis/core.properties

enable.master=false
enable.slave=true

Now we have setup the master-slave replication in the apache solr.


Monday, November 27, 2017

Apache SOLR introduction & installation

In this post, we are going to discuss about Apache Solr and how to install them step by step.

Why Solr?


Lucene:

  • Search storage engine
  • Solr uses concepts derived from Lucene
  • Lucene is widely used in many projects among one of them is solr
  • Used to index & search with high performance.
  • Solr uses lucene as its backend
Solr:
  • Search server
  • Document oriented
  • Stores data & indexing
  • Searches including full-text search, stemming,hit-highlighting, faceted-search etc that cannot done by native databases
  • Vertically and horizontally scalable
  • Replication for high availability
  • Sharding for distributed search
  • Performs in memory,grouping,counting,similar products in single shot
  • Exposed over HTTP,REST like api.
  • The DataImportHandler provides a configuration driven way to import data from relational databases or XML files, into Solr in both “full import” and “incremental delta import” mode.

INVERTED INDEX:

  • Searches document by unique word
  • Similar to the index back of back

D1- I like Apache services.
D2- They include all kind of database & services support.
D3- I would recommend their services to my clients too.

Working:
  • Define a schema. 
  • Deploy Solr.
  • Feed Solr documents for which your users will search.
  • Expose search functionality in your application.
Solr schema:
  • No schema
  • Has index that contain docs
  • Fields are used to index,search & store

Define a schema
The schema tells Solr about the contents of documents it will be indexing. In the online store example, the schema would define fields for the product name, description, price, manufacturer, and so on. 

Defining fields:

Indexing:
Indexing is a technique of adding Document’s content to Solr Index so that we can search them easily. Apache Solr uses Apache Lucene Inverted Index technique to Index it’s documents. That’s why Solr provides very fast searching feature.

Field analyzers: (Analyzer=tokenizer+filters)

Used both during ingestion, when a document is indexed, and at query time.Analyzers may be a single class or series of tokenizer and filter classes.


Alternative words-finish,complete
misspelled-google,gogle

Tokenizers:
Break field data into lexical units, or tokens.
Pre- Stripping html tags
Post-Stemming(replace) tables as collection
         Stop word filter (the,is,and)

Filters:(used for indexing)
  • Examine a stream of tokens and keep them, transform or discard them, or create new ones. 
  • Tokenizers and filters may be combined to form pipelines, or chains, where the output of one is input to the next. 
  • Such a sequence of tokenizers and filters is called an analyzer and the resulting output of an analyzer is used to match query results or build indices.
eg)ram,RAM,Ram


Deploying Solr

Pre requisites:

yum update
yum install java-1.8.0-openjdk.x86_64
java -version

Installation:

tar zxvf solr-6.6.1.tgz
cp /opt/solr-6.6.1/bin/install_solr_service.sh .
rm -rf solr-6.6.1
./install_solr_service.sh solr-6.6.1.tgz
ps -ef | grep solr


Feed Solr documents for which your users will search Creating a project(core): A Core is an Index of texts and fields available in all documents. One Solr Instance can contain one or more Solr Cores. /opt/solr-6.6.1/bin/solr create -c jerwin Create new document : We can create a new document to the core with 3 fields and value using the below command on the terminal using curl: curl http://localhost:8983/solr/jerwin/update -d ' [ {"id" : "db1", "company_name" : "Mafiree", "location" : "Nagercoil" } ]'


View:

The inserted data can be viewed with the id specified.
curl http://localhost:8983/solr/jerwin/get?id=db1


Output can be viewed in the browser:


Hope this gives you simple introduction about SOLR,let me know if you have any concerns via comments.


Explaining PMM server by Percona


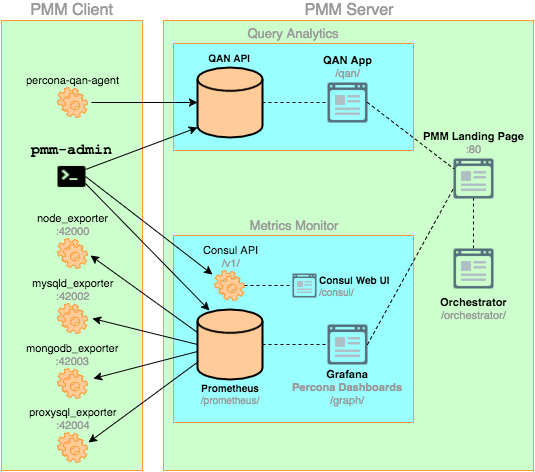
Percona Monitoring and Management 
PMM Client
It is installed on every database host that you want to monitor. It collects server metrics, general system metrics, and query analytics data for a complete performance overview. Collected data is sent to the PMM Server.

PMM Server
It is the central part of PMM that aggregates collected data and presents it in the form of tables, dashboards, and graphs in a web interface.


PMM Client
PMM Client packages consist of the following:
pmm-admin is a command-line tool for managing PMM Client, for example, adding and removing database instances that you want to monitor.
percona-qan-agent is a service that manages the Query Analytics (QAN) agent as it collects query performance data. It also connects with QAN API in PMM Server and sends over collected data.
node_exporter is a Prometheus exporter that collects general system metrics
mysqld_exporter is a Prometheus exporter that collects MySQL server metrics.
mongodb_exporter is a Prometheus exporter that collects MongoDB server metrics.
proxysql_exporter is a Prometheus exporter that collects ProxySQL performance metrics.

PMM Server
PMM Server consists of the following tools:
Query Analytics (QAN) enables you to analyze MySQL query performance over periods of time. In addition to the client-side QAN agent, it includes the following:
QAN API is the backend for storing and accessing query data collected by percona-qan-agent running on a PMM Client.
QAN Web App is a web application for visualizing collected Query Analytics data.
Metrics Monitor (MM) provides a historical view of metrics that are critical to a MySQL or MongoDB server instance.


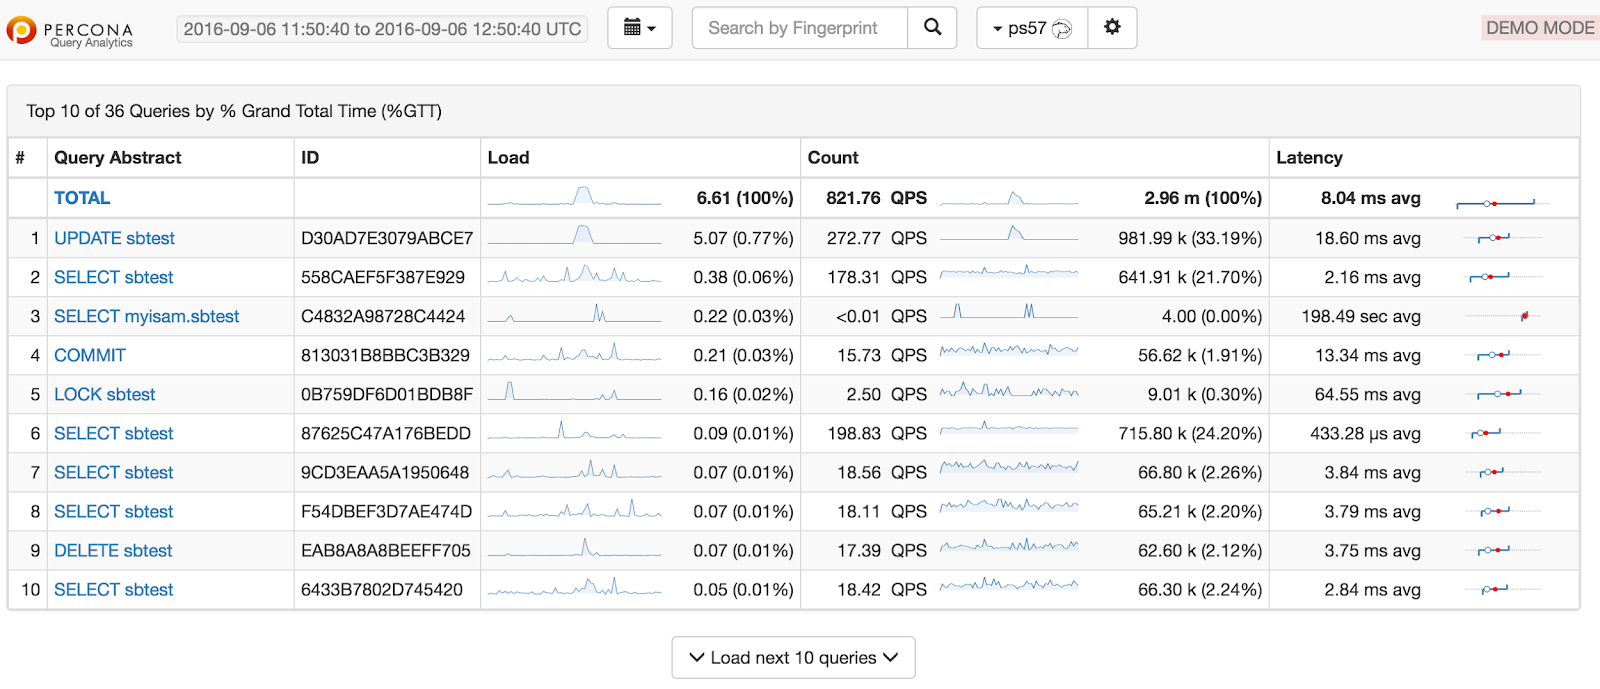
The summary table contains top 10 queries ranked by %GTT (percent of grand total time)
Query details-mysql
Performance schema-mysql
Prometheus is a third-party time-series database that connects to exporters running on a PMM Client and aggregates collected metrics.
Consul provides an API that a PMM Client can use to remotely list, add, and remove hosts for Prometheus. It also stores monitoring metadata.
Grafana is a third-party dashboard and graph builder for visualizing data aggregated by Prometheus.
Percona Dashboards is a set of dashboards for Grafana developed by Percona.
Orchestrator is a MySQL replication topology(NODE) management and visualization tool.
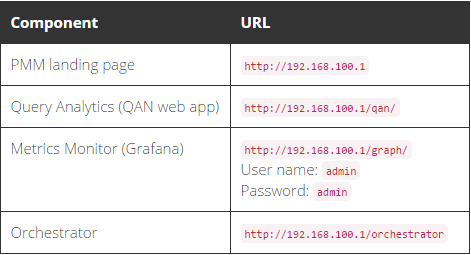
All tools can be accessed from the PMM Server web interface (landing page).Special users must be created for topology generation.
PMM server running methods:
Run PMM Server using Docker
Run PMM Server as a virtual appliance(VM ware,VirtualBox)
Run PMM Server using Amazon Machine Image (AMI)

Docker
Docker is a tool designed to make it easier to create, deploy, and run applications by using containers.
It extracts all the needed packages from https://github.com/docker.

Running PMM Server Using Docker
Step 1. Create a PMM Data Container
docker create \
  -v /opt/prometheus/data \
  -v /opt/consul-data \
  -v /var/lib/mysql \
  -v /var/lib/grafana \
  --name pmm-data \
  percona/pmm-server:1.1.5 /bin/true
docker create-instructs the Docker daemon to create a container from an image.
v- initialize data volumes for the container.
name-assigns a custom name for the container
percona/pmm-server:1.1.5 is the name and version tag of the image to derive the container from.
Step 2. Create and Run the PMM Server Container
docker run -d \
  -p 80:80 \
  --volumes-from pmm-data \
  --name pmm-server \
  --restart always \
  percona/pmm-server:1.1.5
run-instructs the docker daemon to run a container from an image.
d-starts the container in detached mode(bg)
p-port
volumes from-mounts volumes from the pmm-data container
restart-defines the container’s restart policy

Verifying PMM Server
Checkout access the PMM web interface using the IP address of the host where the container is running.

Connecting PMM Client to PMM Server
To connect the client to PMM Server, specify the IP address using the pmm-admin config --server command
$ sudo pmm-admin config --server 192.168.100.1
OK, PMM server is alive.

PMM Server      | 192.168.100.1
Client Name     | ubuntu-amd64
Client Address  | 192.168.200.1

Starting Data Collection
After you connect the client to PMM Server, enable data collection from the database instance by adding a monitoring service.
To enable general system metrics, MySQL metrics, and query analytics, run:
sudo pmm-admin add mysql
To enable general system metrics and MongoDB metrics, run:
sudo pmm-admin add mongodb
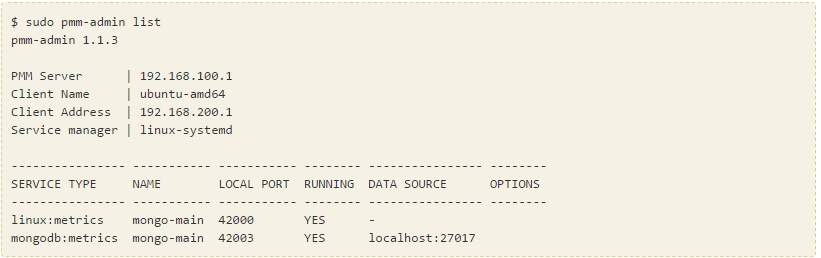
To see what is being monitored, run:
$ sudo pmm-admin list

Upgrading PMM Server
Stop the server
$ docker stop pmm-server
Remove the old server
$ docker rm pmm-server
Run the new one
$ docker run -d \
  -p 80:80 \
  --volumes-from pmm-data \
  --name pmm-server \
  --restart always \
  percona/pmm-server:1.1.5

Upgrading PMM Client
For Debian or Ubuntu:
$ sudo apt-get update && sudo apt-get install pmm-client
For RedHat or CentOS:
$ yum update pmm-client
Removing PMM Server
Stop and remove the pmm-server container:
$ docker stop pmm-server && docker rm pmm-server
If you also want to discard all collected data, remove the pmm-data container:
$ docker rm pmm-data
Removing PMM Client
If you installed using RPM packages:
$ rpm -e pmm-client
If you installed using YUM:
$ yum remove pmm-client
If you installed using DEB packages:
$ dpkg -r pmm-client
If you installed using APT:
$ apt-get remove pmm-client

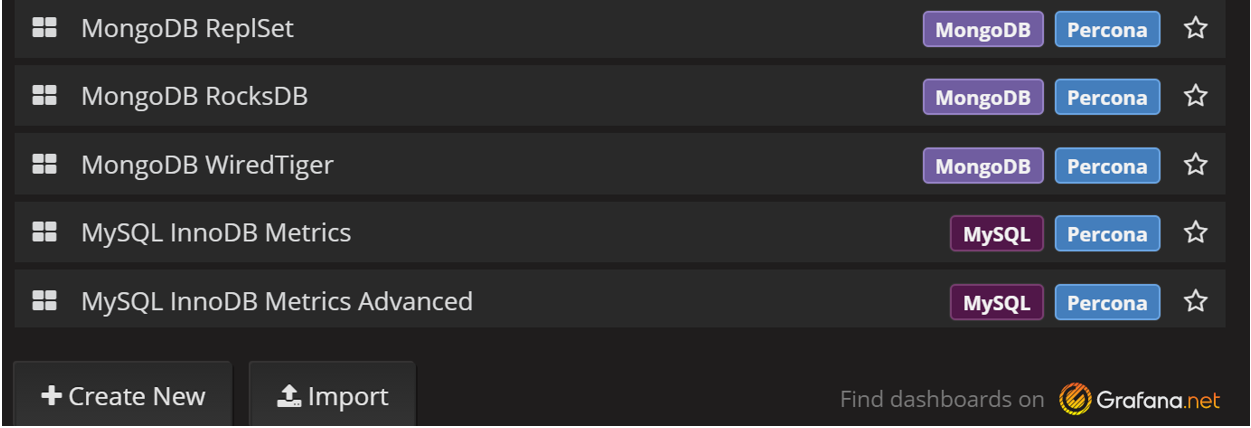
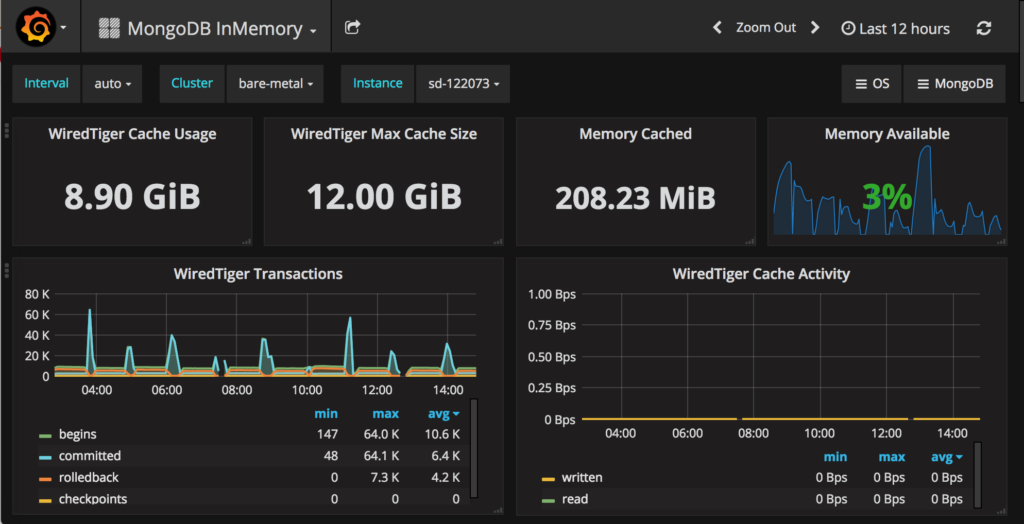
Dashboards: